The Laravel debug toolbar is, first and foremost, a package written by Barry vd. Heuvel that lets you keep an eye on your application quickly and easily while you are developing it. It installs in minutes and belongs to the handful of packages worth knowing about.
Installing the package
Installing the Laravel debug toolbar is fairly simple. We start with Composer and run the composer require command to download the package.
composer require barryvdh/laravel-debugbarThen open the config/app.php file and add this inside the Providers array:
Barryvdh\Debugbar\ServiceProvider::class,Next, add its alias to the Facades array:
'Debugbar' => Barryvdh\Debugbar\Facade::class,And finally, do not forget to run the following command:
php artisan vendor:publish --provider="Barryvdh\Debugbar\ServiceProvider"That is it, the Laravel debug toolbar is installed. As long as your application is in debug mode, the bar shows up and displays some useful statistics about the page you are looking at.
A tour of the options
Here is what the toolbar looks like:
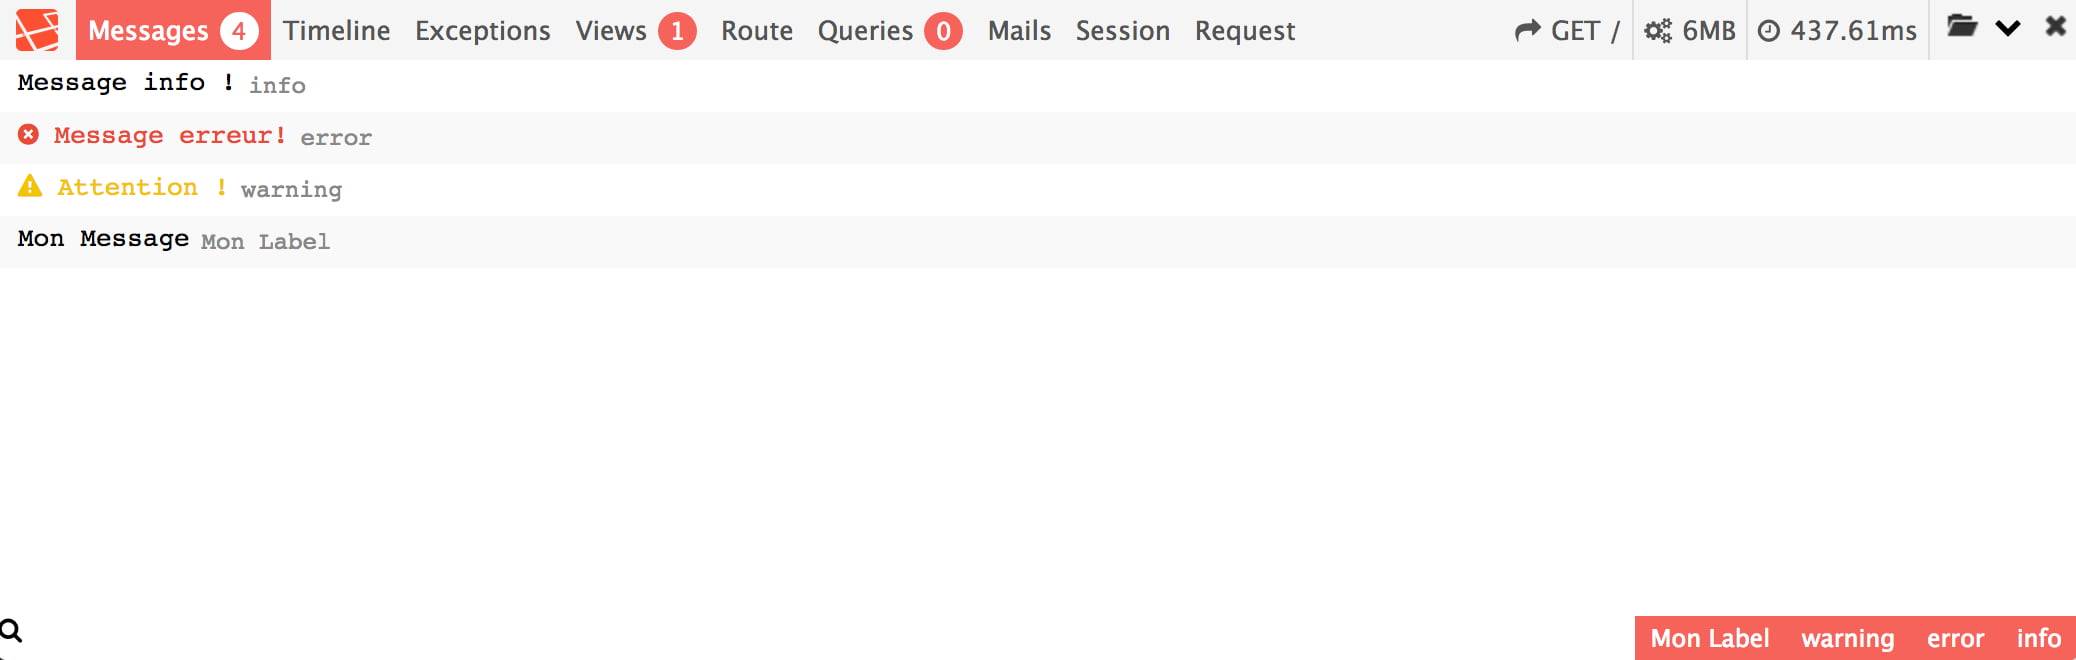
Message
Messages is the section that displays the messages or the tests you have put in a controller, a model, and so on.
Debugbar::info("Message info !");
Debugbar::error('Message erreur!');
Debugbar::warning('Attention !');
Debugbar::addMessage('Mon Message', 'Mon Label');
Messages cover the PSR-3 levels (Emergency, Alert, Critical, Error, Warning, Notice, Info, Debug).
Timeline
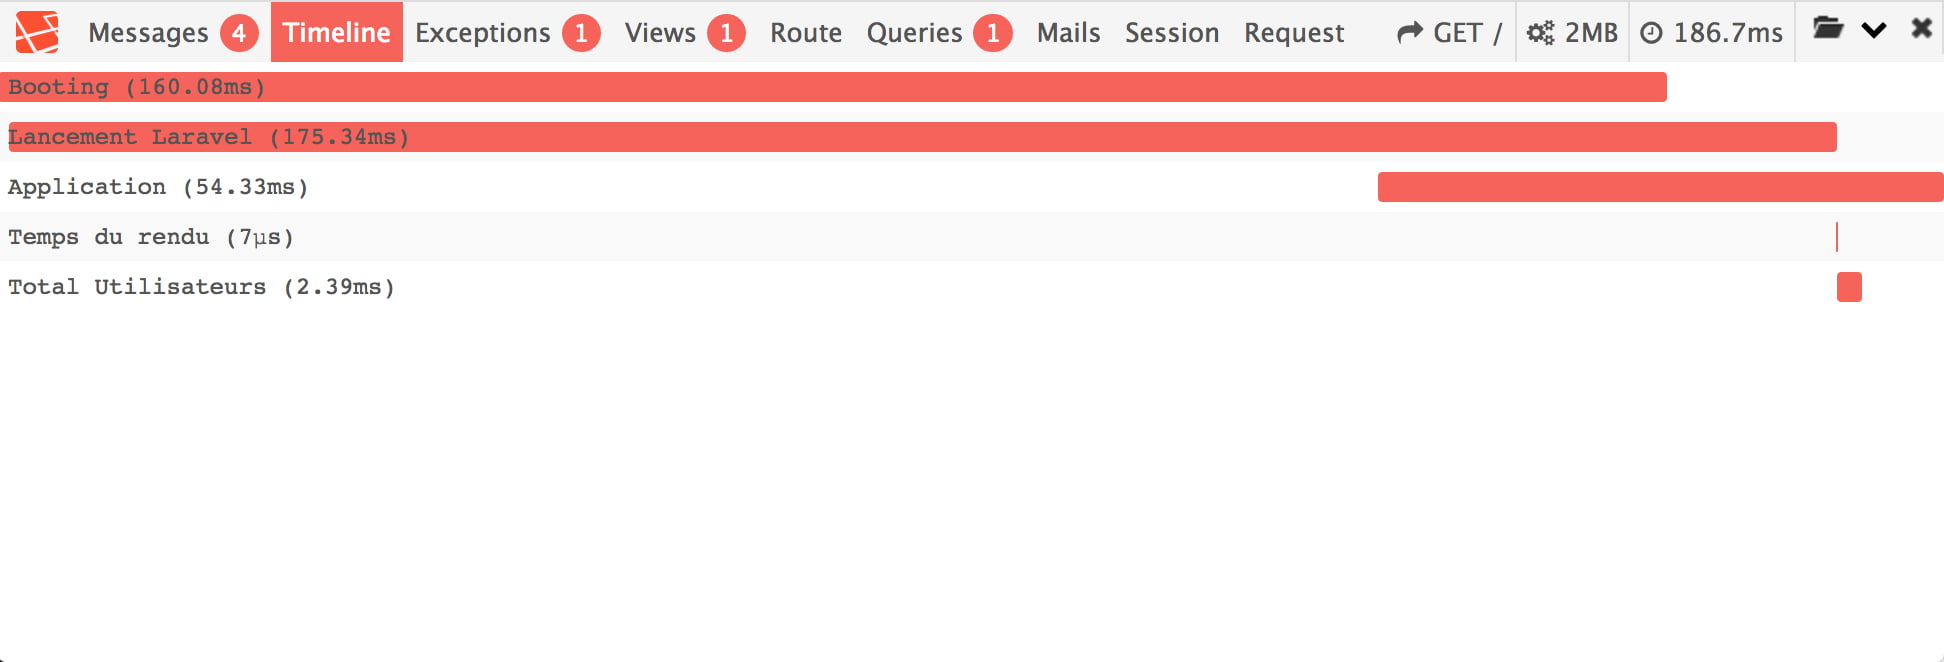
The Timeline is handy for fixing code that holds back the performance of your application. Here are a few examples:
Debugbar::startMeasure('render','Temps du rendu');
Debugbar::stopMeasure('render');

Debugbar::addMeasure('Lancement Laravel', LARAVEL_START, microtime(true));
Debugbar::measure('Total Utilisateurs', function() {
    $user = App\User::all();
});
Exceptions
The next tab records exceptions. You can log exceptions and have them show up in the debug bar:
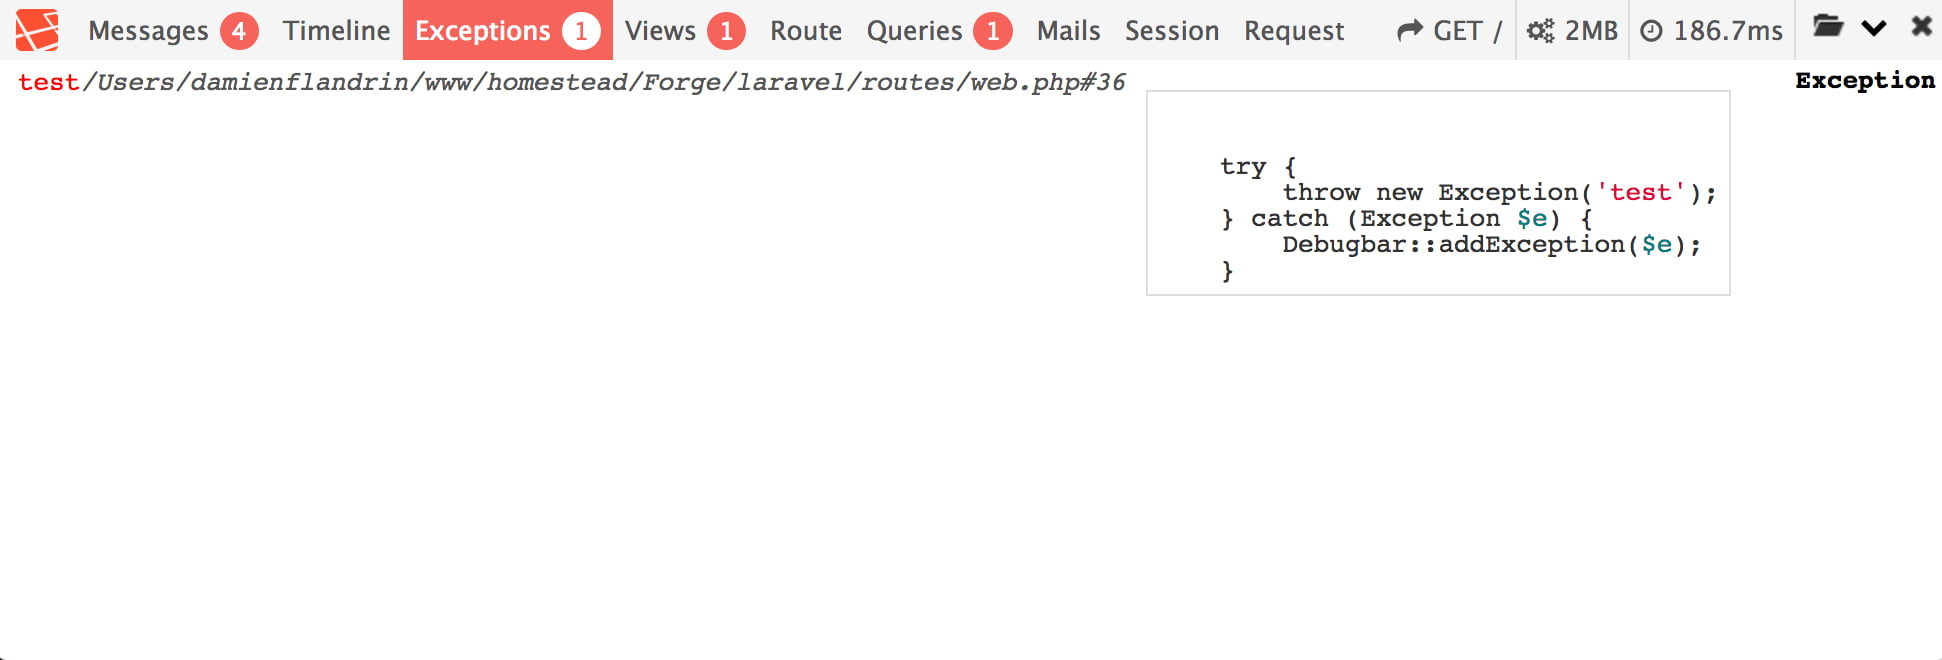
try {
  throw new Exception('test');
} catch (Exception $e) {
  Debugbar::addException($e);
}
Views

Views shows you every parent and child template along with all the parameters passed to them. With this tab you can make sure you are only sending the data you actually need:
return view('welcome')->with('titre', 'Mon Titre')->with('message', 'Mon Message');Route
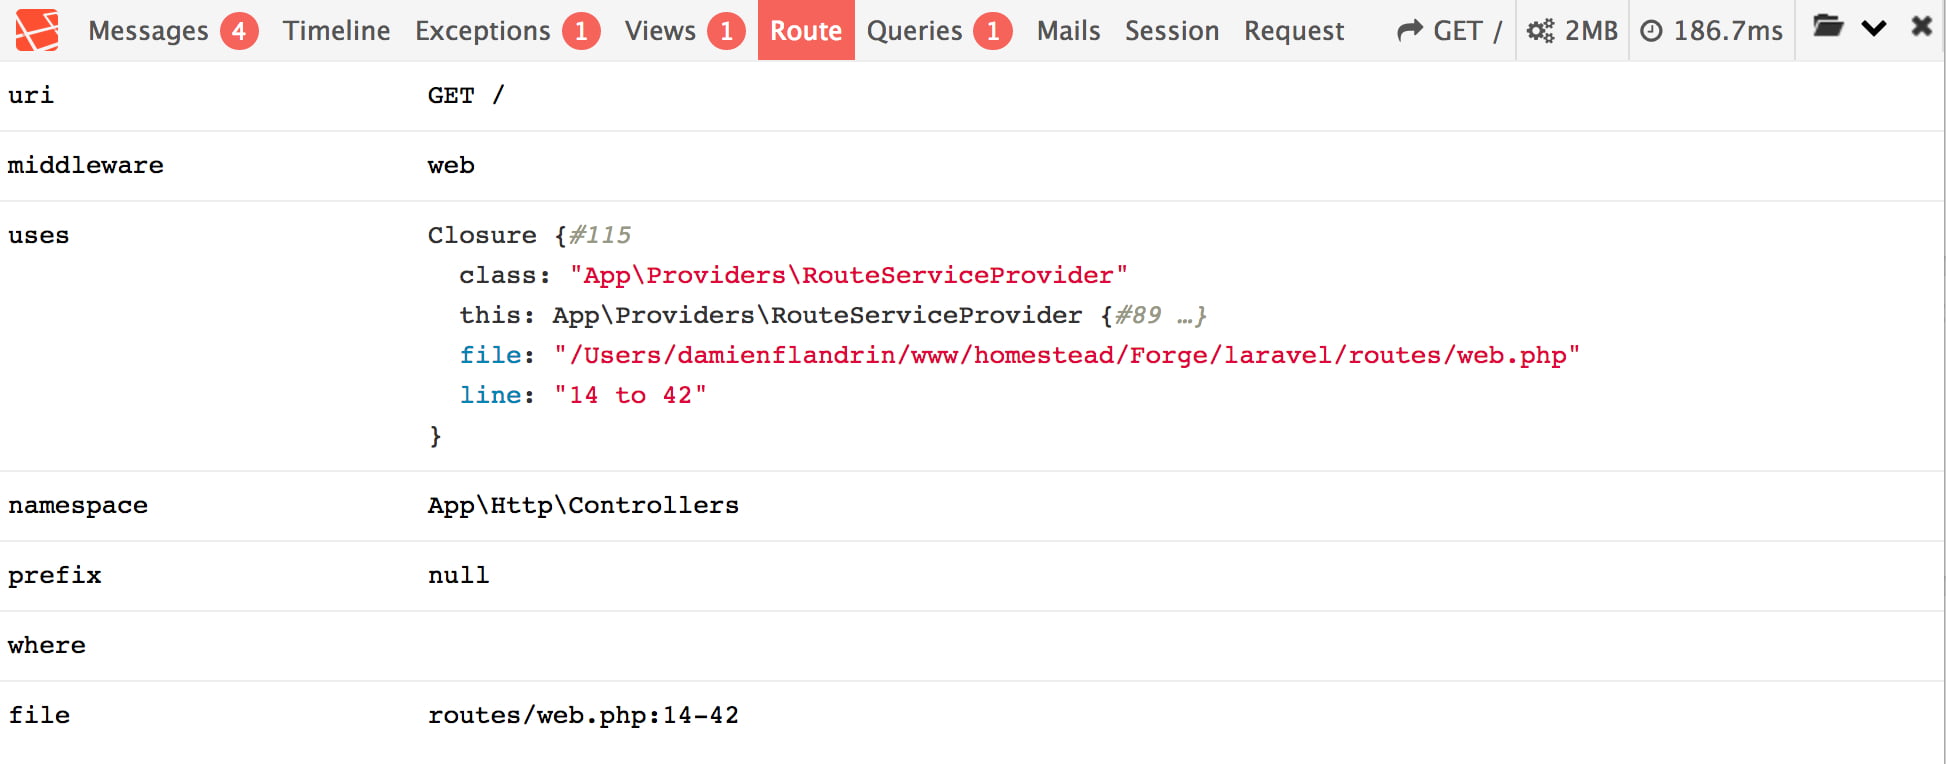
Not much to say here, it speaks for itself. Route covers everything to do with your route: its controller, the URI used, its prefix, its namespace and so on.
Query

Queries are one of the most important parts of an application, and this tab is where you find everything about the queries you send to your database server. Badly optimised or unwanted queries can really drag out your page loads and hurt your users.
Mail and Request
These two cover everything you need to know about outgoing emails and about requests.
···